
A few weeks ago, I wrote about calculating the integral of data in Excel. This week, I want to reverse direction and show how to calculate a derivative in Excel. Just like with numerical integration, there are two ways to perform this calculation in Excel:
- Derivatives of Tabular Data in a Worksheet
- Derivative of a Function using VBA (or Visual Basic for Applications)
For this post I’m going to focus on calculating derivatives of tabular data, with a post about calculating the same using VBA coming at a later date.
How to Differentiate in Excel
This is the kind of derivative calculation that is typically performed on experimental data. It can be especially useful when you were not able to directly measure the quantity of interest, but were able to measure its integrand.
The classic example, of course, is position and velocity:

Elevate Your Engineering With Excel
Advance in Excel with engineering-focused training that equips you with the skills to streamline projects and accelerate your career.

Say for instance, you performed some experiment where it was difficult to obtain the velocity directly. So instead, you measured the position at various times, t. You could import the data into Excel and calculate the velocity as the derivative of position with respect to time.
Excel Derivative Formula using the Finite Difference Method
The method used to perform this calculation in Excel is the finite difference method.
To use the finite difference method in Excel, we calculate the change in “y” between two data points and divide by the change in “x” between those same data points:
This is called a one-sided estimation, because it only accounts for the slope of the data on one side of the point of interest. The formula above returns the same result as the SLOPE function in Excel, so we could use that. However, it’s not the preferred method.
A better estimation would be to calculate the average slope at the point of interest by averaging the slope directly before and after that point.
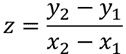
So, if we wanted to find the slope at y2 (z), we could use this calculation:

This derivative formula is known as a central finite difference.
Example: Calculate a Derivative in Excel
Let’s look at how to calculate a derivative in Excel with an example. We can use the position data that was calculated by integrating velocity data in the previous post and use it to calculate both the velocity and the acceleration. As a check, we will compare the calculated acceleration data to the initial acceleration data.
To make things easier for now, I’ve hidden the old acceleration and velocity data. We’ll look at how they compare at the end.
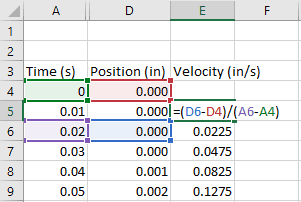
How to Calculate Velocity in Excel
First, I calculate the velocity as the derivative of the position data using the finite difference equation above. Since we need a y3 and a y1, I start the calculation in Cell E5 and fill it down.
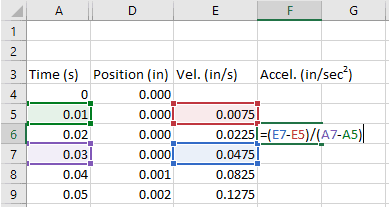
How to Calculate First Derivative in Excel
Next, using the calculated velocity, I can calculate the acceleration (which is the first derivative of velocity) using the same method. This time, the calculation is started in Row 6.
Results
In theory, if we differentiate data obtained by integration then we should end up back at the original data. Of course, all numerical methods impart some kind of error into the data.
But how bad is the error? Let’s compare.
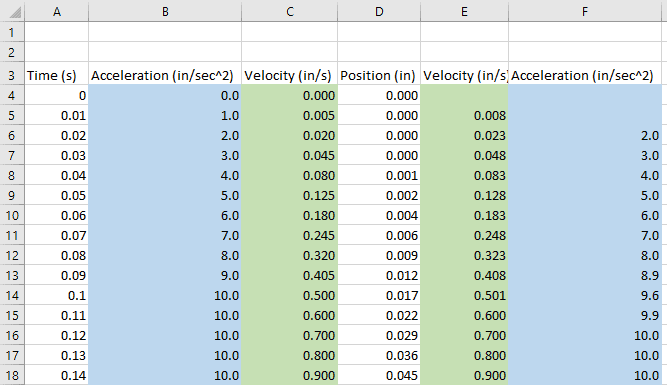
In this case, we can see some slight differences between the initial acceleration data and that obtained by differentiation in Excel. There are also some slight differences in the two velocity data sets. Fortunately, the error in numerical differentiation is not cumulative, unlike with numerical integration.
Tables of data are not an ideal way to examine this data, so let’s look at the plots:
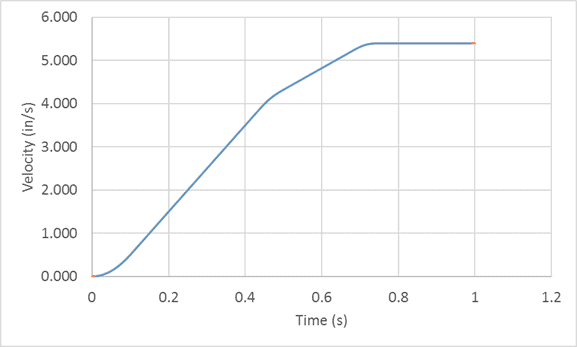
It’s hard to see because the two lines are on top of each other, but for all practical purposes the velocities are identical.
How about the acceleration?
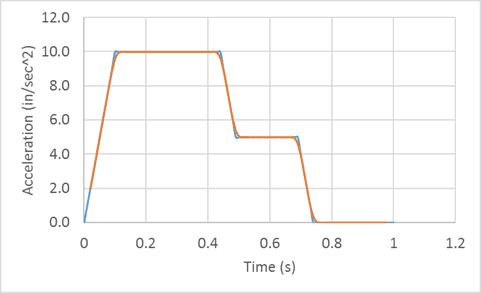
Here we can see that during periods of steadily increasing or constant acceleration, the two data sets are very similar. However, when there is a discontinuity in the acceleration data (i.e. at times 0.1, 0.45, 0.5, 0.7, and 0.75 sec) the acceleration obtained by differentiation (orange) does not match the original acceleration data (blue).
This is due to the equation that we used to perform the differentiation. Remember how we obtained the derivative at a point by averaging the slope on either side of that point? We’re seeing the results of that here.
Wrap Up
If you’ve followed along with the instructions, then congratulations! You’ve just performed numerical differentiation using Excel. Calculating a derivative in Excel isn’t that difficult once you know how to do it.