
All too often in engineering we tend to assume that the variables that affect our designs are (*fancy word alert*) “deterministic“. In other words, we assume that they are repeatable and we can know exactly what they will be beforehand. However, the fact is that all variables that affect the performance of a design exhibit randomness (the smart word is “probabilistic“). To understand how much the randomness affects performance, we can perform a sensitivity analysis Excel calculation, where we vary one or more of the inputs and see how it causes a desired output to change. Excel has a built-in tool called Data Tables that allows us to make the transition from deterministic to probabilistic analysis quickly.

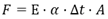
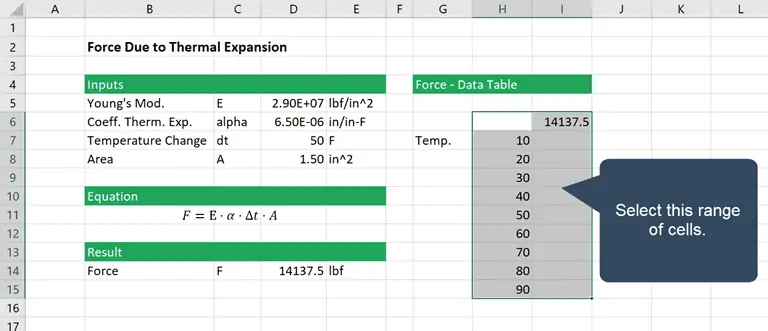
In this example, we’ll look at the variation in force in a simple fixed-length column that is subjected to changes in temperature. The change in force is described by the equation:

Elevate Your Engineering With Excel
Advance in Excel with engineering-focused training that equips you with the skills to streamline projects and accelerate your career.
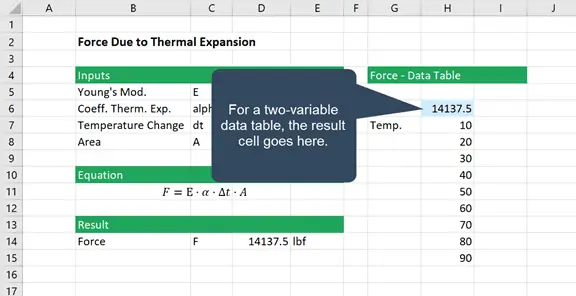
The result for a single set of inputs is shown below:
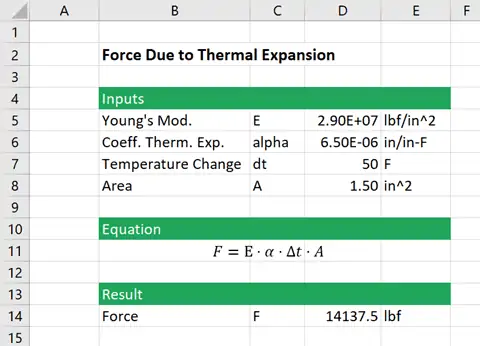
If we want to understand how the force changes with a change in temperature due to the thermal expansion coefficient, we can create a data table.
Single-Variable Sensitivity Analysis Excel Data Tables
The first step in creating a data table that predicts force as a result of changing temperature is to create column of varying temperature somewhere on the worksheet.
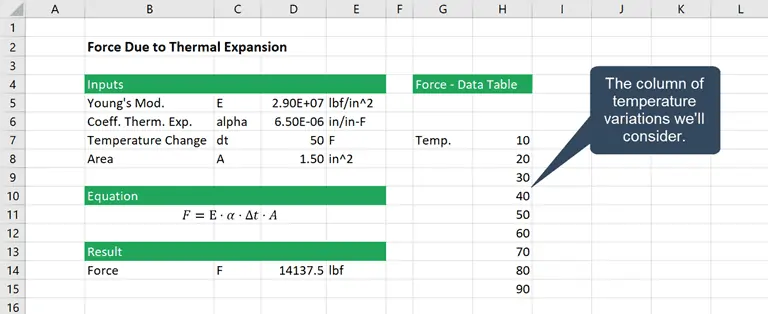
In the cell immediately above and to the right, calculate the result or link to the cell that already contains the result.
Then, select the range that contains the column of varying inputs as well as the result cell.
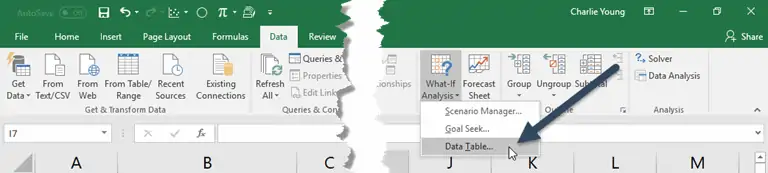
Open the Data Table tool from Data>What-If Analysis> Data Tables.
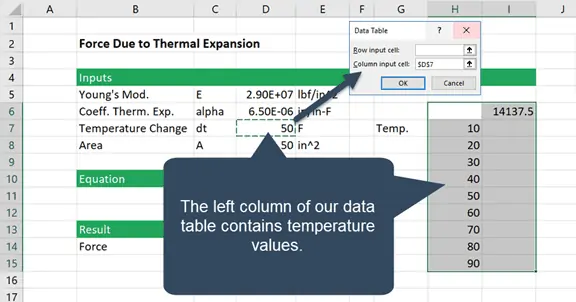
Since the columns contain temperature values, we’ll select the temperature input cell as the “column input cell”. By doing so, the data table knows to substitute the temperature values in the column with the temperature variable in the calculated force.
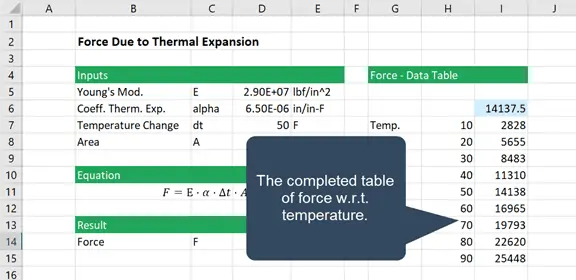
When we click OK, the Output is a table of force with respect to temperature that enables us to view the sensitivity of the force to changes in temperature.
Two-Variable Data Tables
You may have noticed that the data table dialog has an input for both column and row inputs. This allows us to create two-variable data tables. So let’s look at what happens to our force as both the temperature and coefficient of thermal expansion vary.
We can leave the column of temperature, but we’ll delete the existing force results and move the result to the cell immediately above the temperature column.
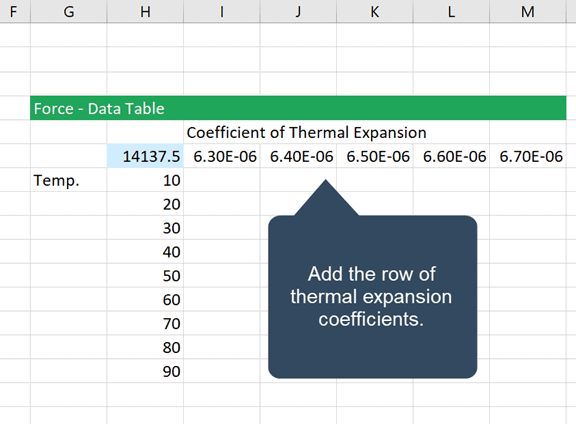
Now we can enter a row of thermal expansion coefficients next to the result cell:
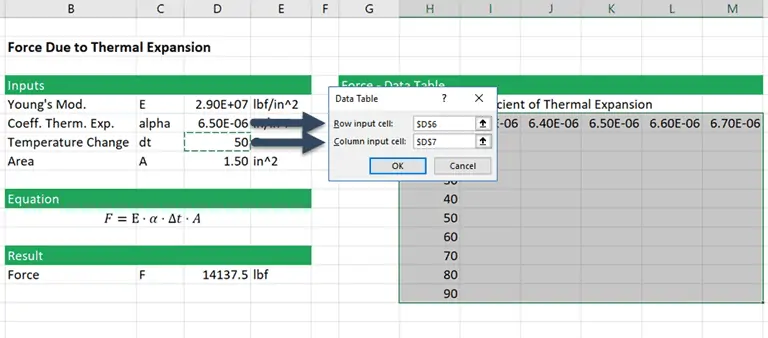
Next, select all of the rows and columns in the table and open the Data Table tool. Since the rows contain the variable coefficient of thermal expansion data, select that input cell as the “row input cell”. And, like before, select the temperature input cell as the column input cell, since the column contains temperature data.
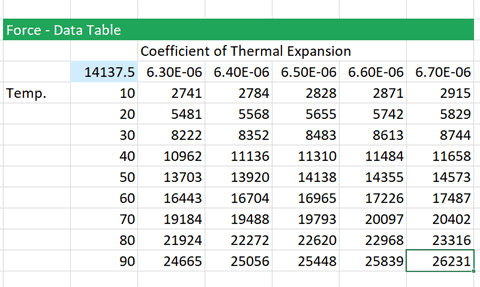
Click OK and the table is completed, allowing us to see the sensitivity analysis Excel calculation of force to both temperature and coefficient of thermal expansion:
Limitations:
Data tables are a powerful tool that can even open the door to advanced Monte Carlo Simulation in Excel. However, they do have a few limitations:
- Data tables cannot be used in a different worksheet than your input cells. However, there are some workarounds for this. See here for more information.
- Data tables can significantly slow down recalculation of a worksheet or workbook. Excel allows you to turn off automatic data table recalculation (Formulas>Calculation Options>Automatic Except for Data Tables). However, this is NOT RECOMMENDED as you or someone else could easily forget to recalculate the data table at some point.