
Excel also can perform a regressions with a function. The function LINEST can find the equation of a best fit line through data.
LINEST uses the least squares method to fit a line or curve to some data that you provide. It returns back the coefficients that describe the line or curve to best fit the data. Its syntax is as follows:
LINEST(known_y’s, [known_x’s], [const], [stats])
known_y’s: an array of known y-values
known_x’s: (optional) an array of known x-values. If omitted, assumed to be the array {1, 2,
3…n} where “n” is the length of known_y’s

Elevate Your Engineering With Excel
Advance in Excel with engineering-focused training that equips you with the skills to streamline projects and accelerate your career.
const: (optional) specifies whether to force the y-intercept to equal zero (FALSE = y-intercept of 0)
stats: (optional) specifies whether to return regression statistics. (FALSE = no statistics)
It isn’t mandatory to include the range of x-values, but the examples that you’ll see here will use specify x-values in this argument.
The worksheet contains the bolted joint example that you saw in the last section. You can use LINEST to calculate the coefficients that define the best-fit line. The difference from the trendline method is that LINEST will output the coefficients into cells instead of on a graph. This is useful when you’re going to use those coefficients in other calculations.
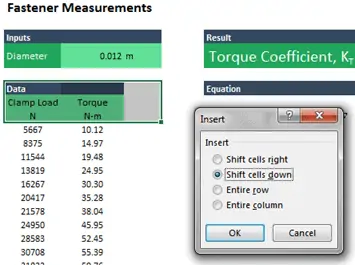
The worksheet is set up using a trendline equation to find the slope, and the slope is manually entered into cell G5. If new input data were inserted, the chart and trendline equation would update automatically, but the calculation of the torque coefficient would not. LINEST will give you an output that will update when the data change.
To create a place to store the slope, select the 3×3 area below the diameter, right-click, and choose Insert. Choose Shift cells down in the box that appears.
Select the Inputs data table, and then click in the first section of the Home tab. This will give you a table with the same format in a different place on your worksheet. Click within the empty space you just created to make a new formatted table:
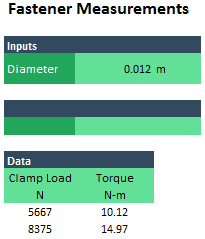
Add the name Calculations in the header of the new table. Add the label Slope on the left and the units m on the right.
Now that the table is set up, you can enter the function. Begin it:
=LINEST(
Then, select the known y-values (the torque values). Add a comma and select the known x-values (the clamp load).
=LINEST(C13:C30,B13:B30,
The next argument tells the function whether to force the y-intercept to zero or not. In this case, it physically makes sense that the clamp load will be zero when the torque is zero, so this argument is FALSE. The final argument will be FALSE as well so the function won’t return regression statistics.
=LINEST(C13:C30,B13:B30,FALSE,FALSE)
LINEST is an array formula since it is capable of returning multiple values. In this case, we’re only returning a single result in a single cell, so there’s no need to use Ctrl-Shift-Enter. Just press Enter and LINEST will return the slope.
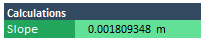
LINEST returns a slope that is almost the same as the trendline equation, but with several more significant digits. Next, update the torque coefficient calculation to reference the result of the LINEST formula instead of a fixed value. In cell G5, enter:
=C8/C5
This way, if the data change, the torque coefficient will automatically update.
To test this, enter a 2 into any empty cell in the worksheet. Copy it with Ctrl-C, then select the torque data. Right-click and choose Paste Special. In the window that appears, choose Multiply:

This will double all the torque values. Automatically, the LINEST result updates, as does the torque coefficient. This is why you may want to use LINEST to extract the slope and/or intercept of a line fit rather than just using a trendline in a chart.
In the next section, you’ll see how to manually control the linear regression process using the Solver add-in.